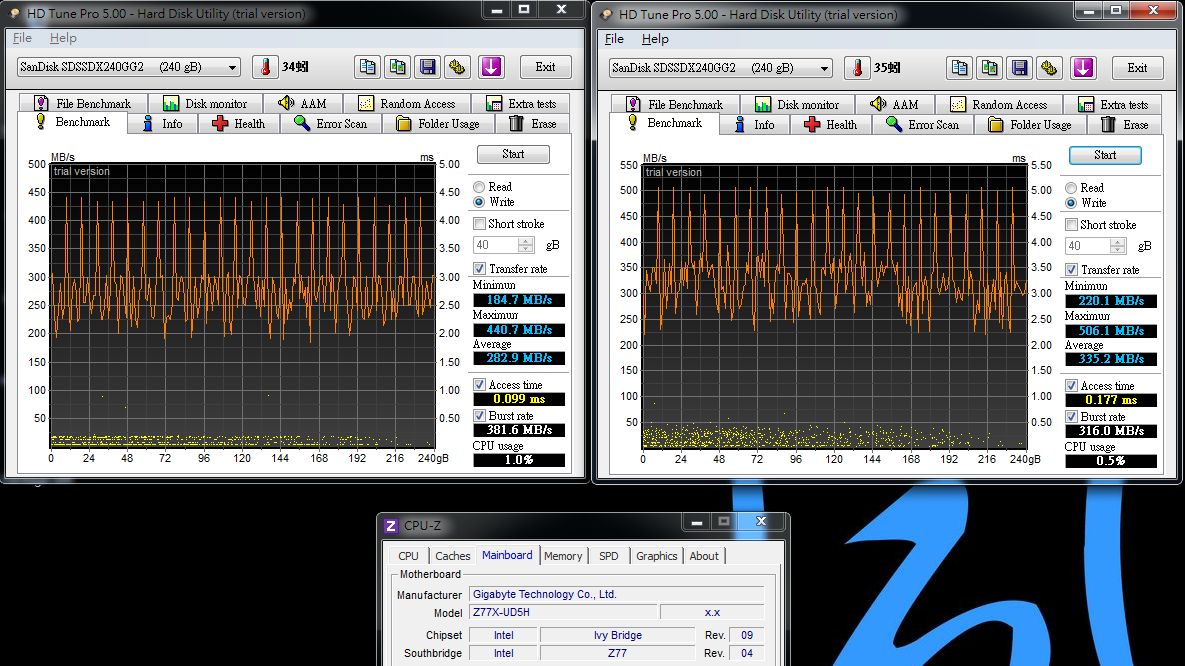
HD Tune Pro 5.00將Black Size設定為1MB就可以接近最佳效能
64K - Write - Average 282.9 MB/s Access Time 0.099ms
1MB - Write - Average 335.2 MB/s Access Time 0.177ms
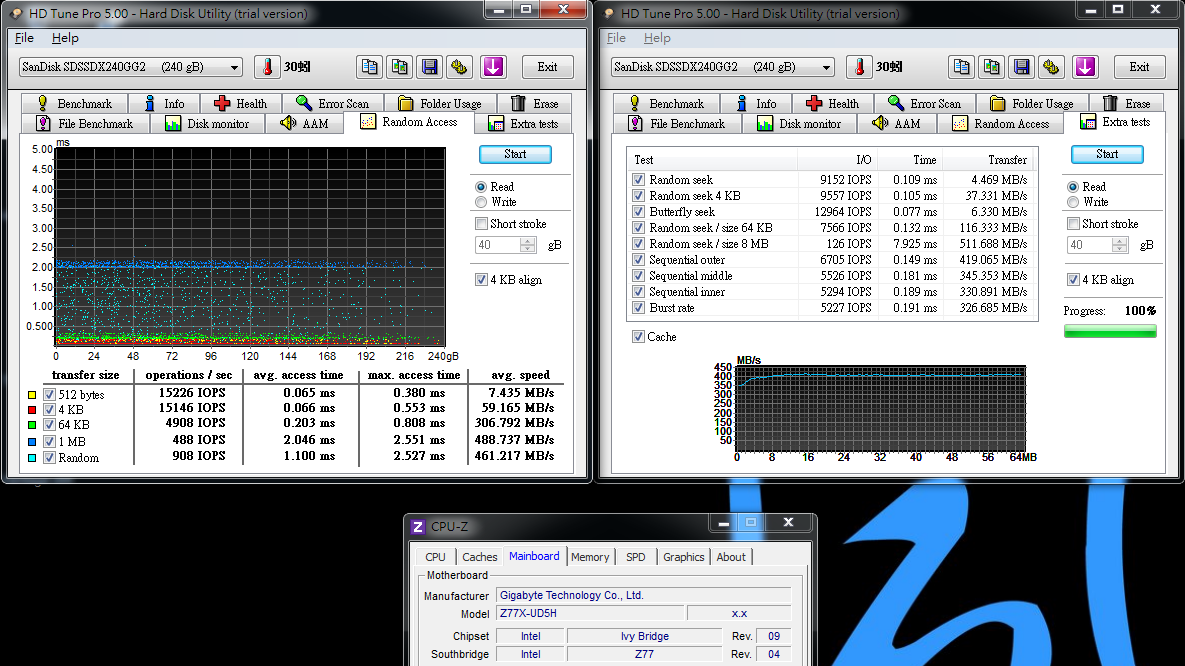
Read - Random Access & Extra tests
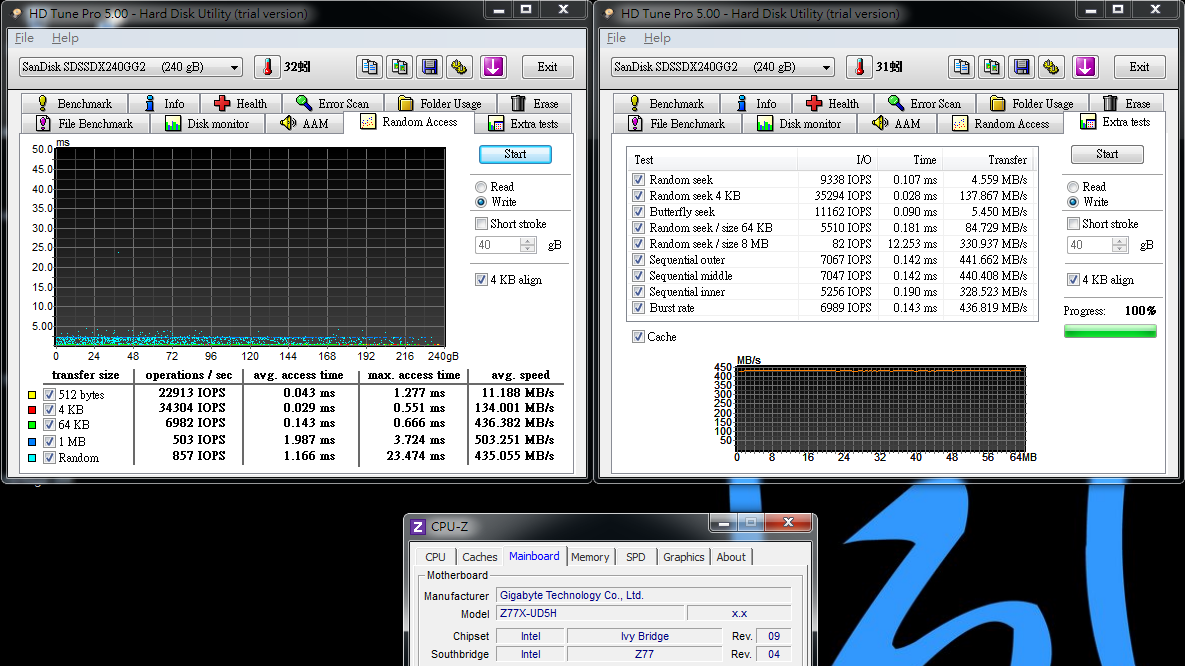
Write - Random Access & Extra tests
File Benchmark
Sequential Read - 60431 IOPS / Write - 91977 IOPS
ATTO DISK Benchmark超過512k以上測試時就達到最高讀取559.2 Mb/s,寫入535.6 MB/s
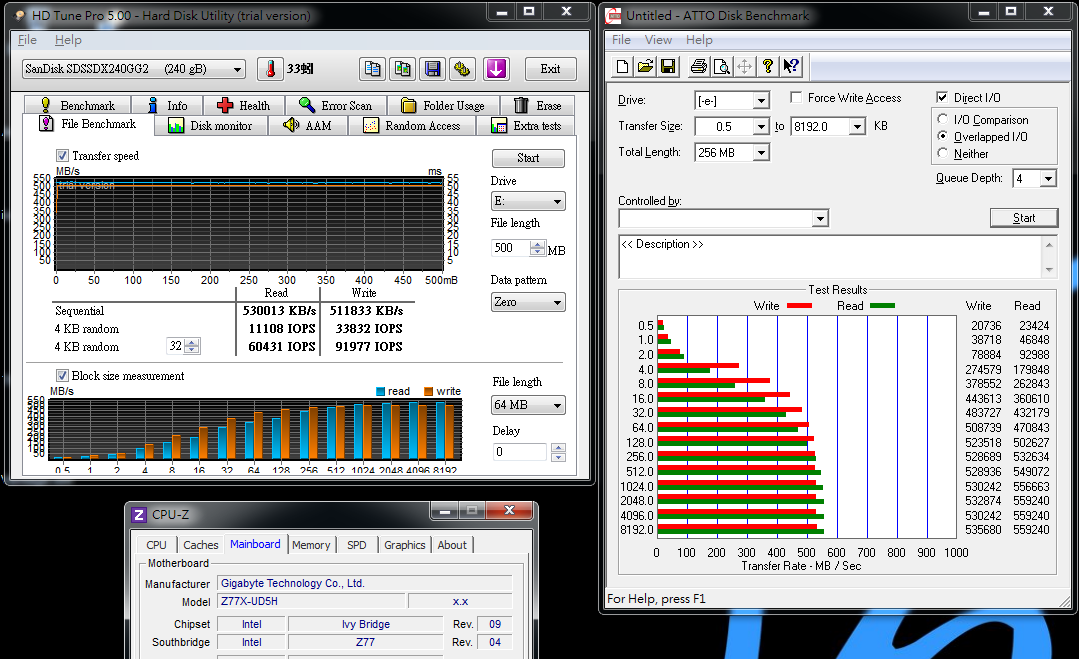
HD Tune Pro 5.00在File Benchmark項目改得更為精細,能參考的項目也隨著更多
ATTO DISK Benchmark也超越原廠標示的讀取550與寫入520 MB/s之規格
CrystalDiskMark
Seq Read - 524.6 MB/s Write - 298.3 MB/s
<All 0xFF, 0Fill> Read - 530.0 MB/s Write - 525.7 MB/s
<All 0x00, 1Fill> Read - 529.6 MB/s Write - 525.7 MB/s
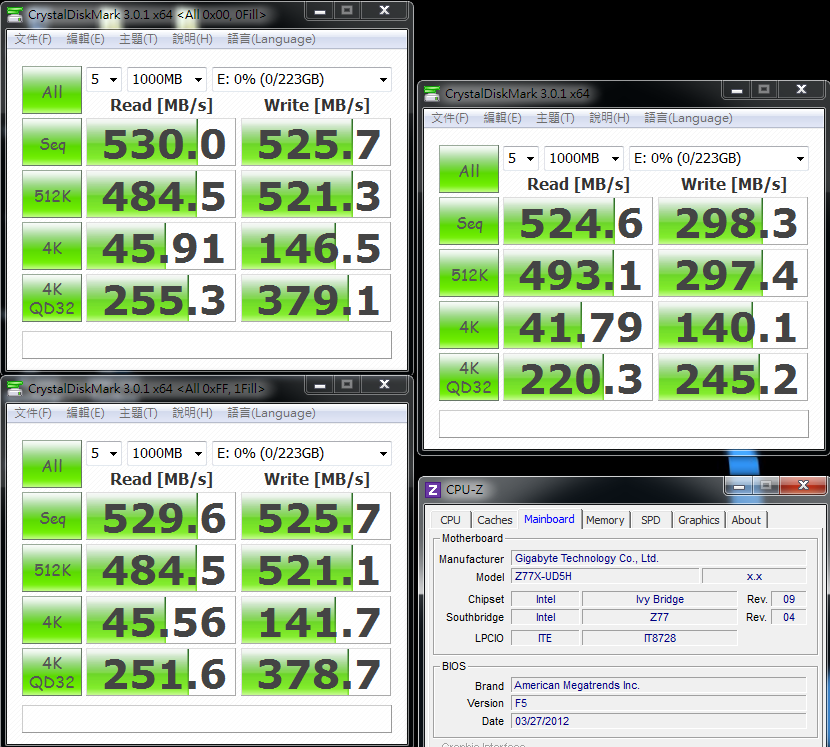
CrystalDiskMark預設測試為隨機測試,如右圖在寫入的數據會偏低
這部份主要是因為SandForce控制晶片的架構特性,在此種軟體預設的演算方式會碰到偏低的狀況
左圖CrystalDiskMark測試改為兩種純粹循序模式,寫入表現就可以接近官方規格的數據
SandForce在Sequential Write使用特殊的演算方式,起速200多MB/s慢慢加到500 MB/s
這也是SandForce控制晶片在架構上較為薄弱的一個環節
AS SSD Benchmark - 824
Seq Read - 519.10 MB/s Write - 280.41 MB/s
4K - 64Thrd Read - 227.01 MB/s Write - 222.52 MB/s
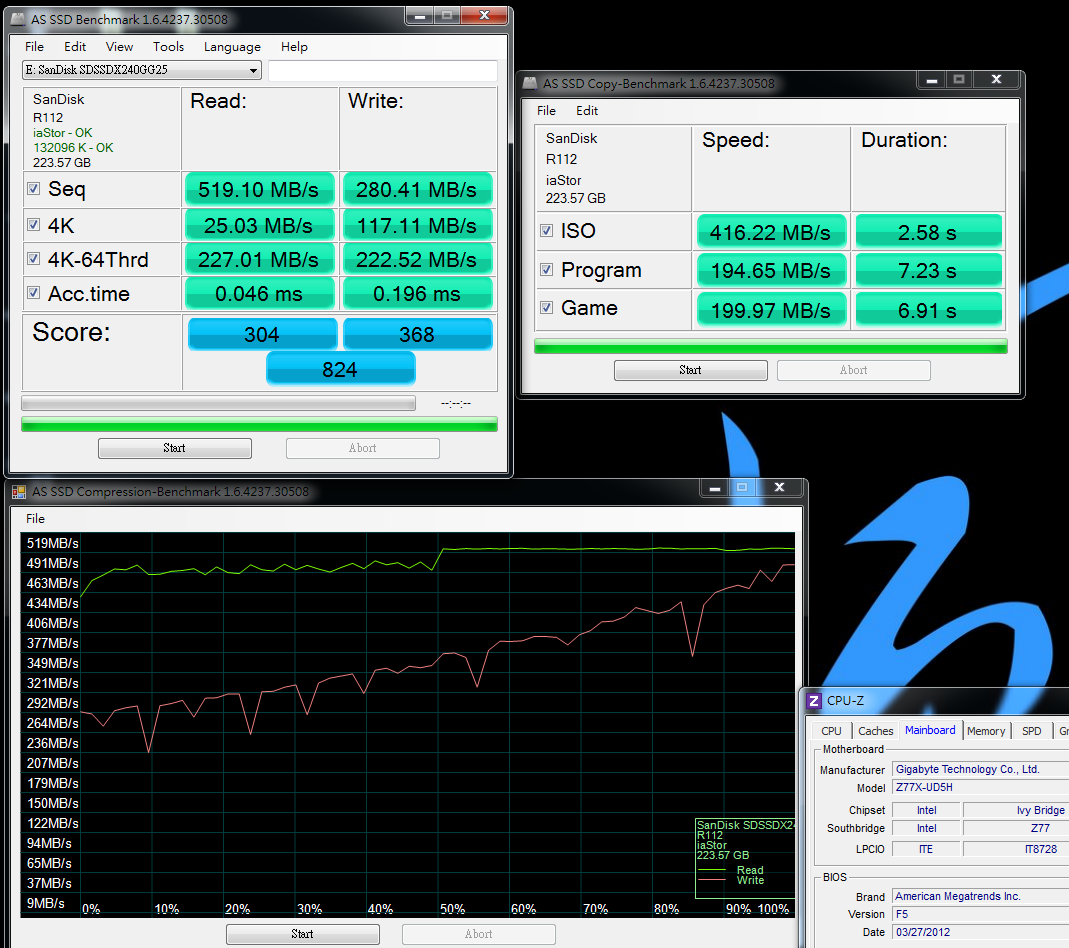
SandForce架構會依SSD容量不同而有所變化
AS SSD Benchmark使用120GB可達到約500多分,而使用240GB會提升到700~800分以上
也可以由兩種容量數據中能得知,240GB在Write的Seq / 4K-64Thrd都明顯比120GB有顯著提升
AS SSD Benchmark依windwithme個人使用經驗來看,配分比較著重於4K與4K-64Thrd
在這兩個項目如果傳輸能力較高的話,得分也會比較容易偏高
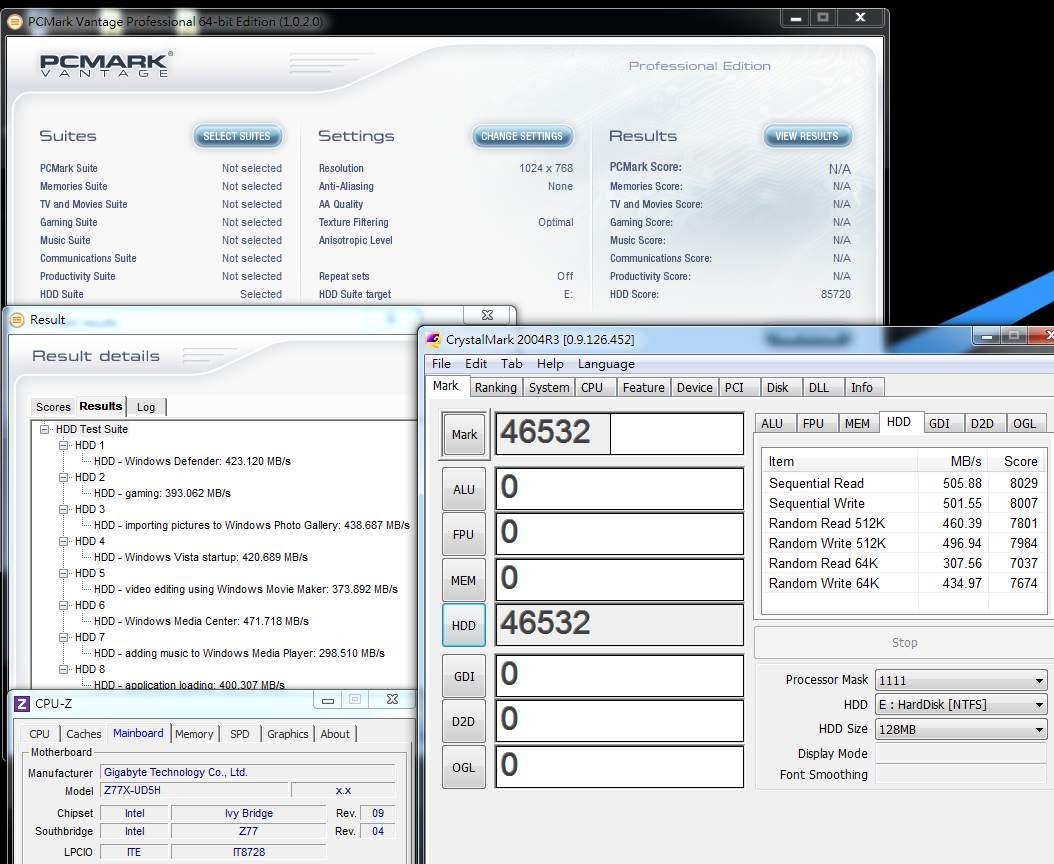
PCMark Vantage - HDD Score : 85720
CrystalMark Sequential Read 505.88 MB/s Sequential Write 501.55 MB/s
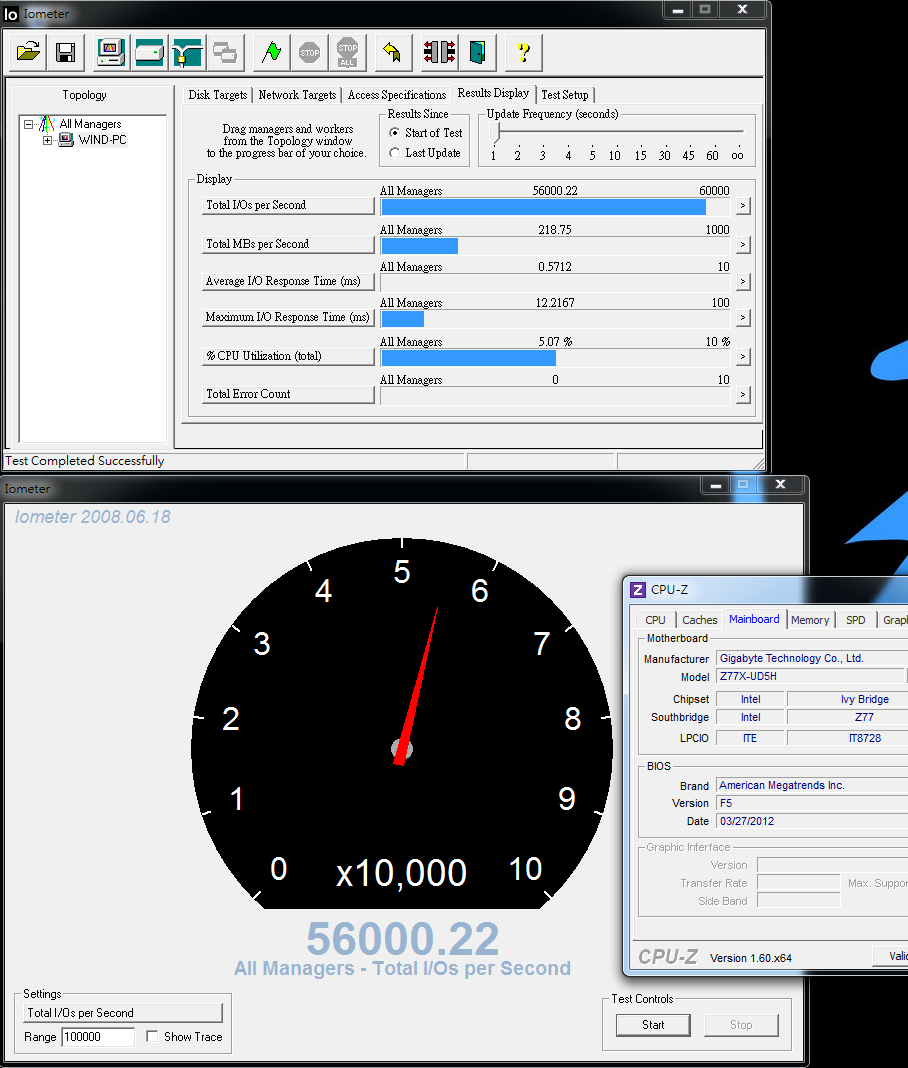
IOMETER 2008
1分鐘 - 100% Read / 100% Random 4KB
Total I/Os per Second 57420.61
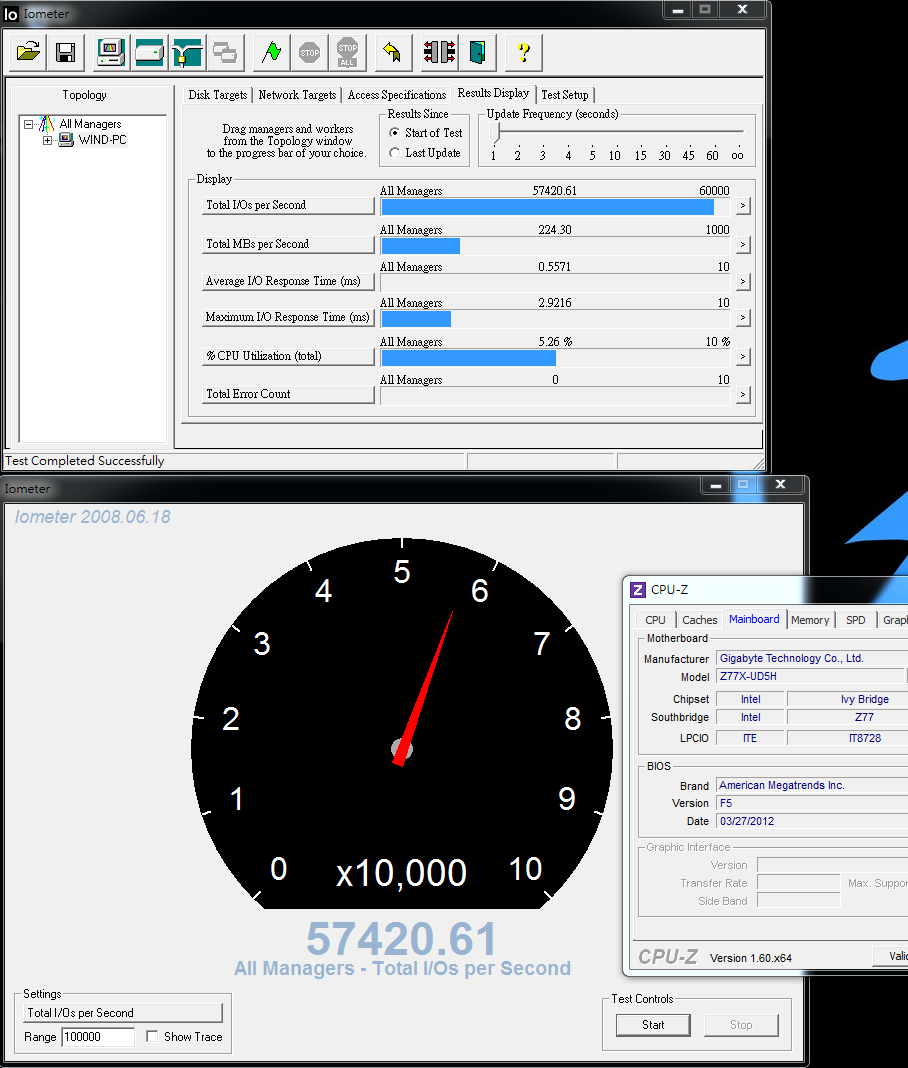
3分鐘 - 100% Read / 100% Random 4KB
Total I/Os per Second 56000.22
1分鐘 - 100% Write / 100% Random 4KB
Total I/Os per Second 91930.96
